Public attitudes to the NHS and social care

The Chancellor of the Exchequer, Jeremy Hunt, is finalising his Autumn Statement against the backdrop of what Prime Minister Rishi Sunak has called a “profound economic crisis”. As the two men prepare to take decisions that will shape fiscal and spending policy for the rest of this Parliament and beyond, what are the public’s priorities on taxation, welfare and public spending, and how have these changed in recent years?
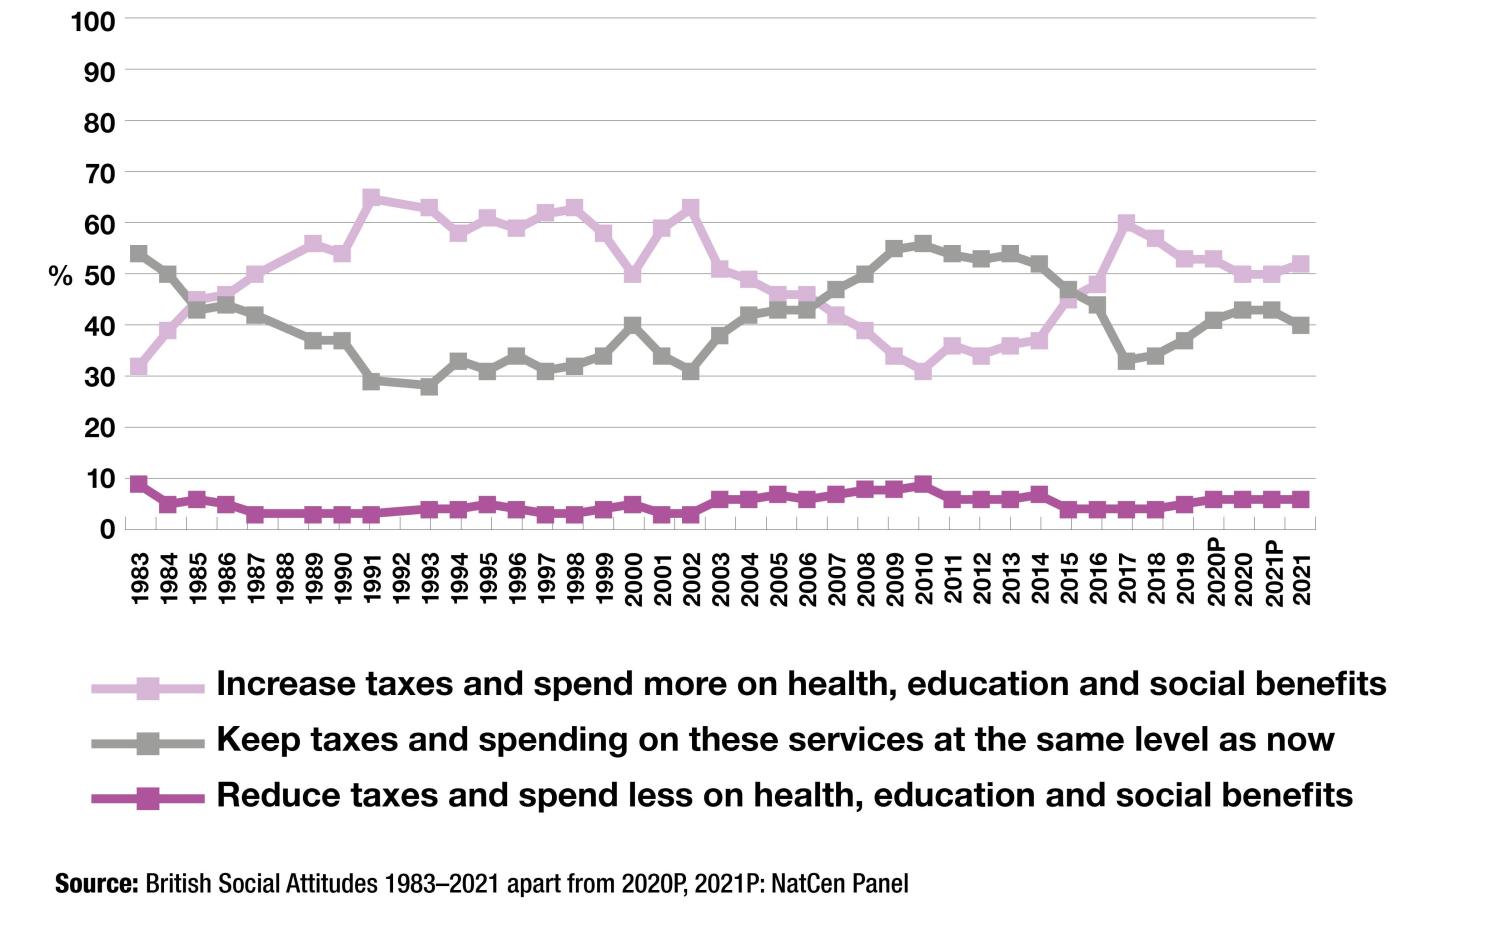
The National Centre for Social Research (NatCen)’s flagship British Social Attitudes survey has tracked views on public expenditure priorities since 1983. Cutbacks in taxes and spending have never been popular, but opinion has see-sawed between wanting to keep taxation and expenditure stable, and seeking an increase in both (see Figure 1 below). After the years of austerity, which saw cuts to many public services, the balance tilted towards increased tax and spending in 2016. While the gap has narrowed since 2017, this remains the majority position.
Figure 1 - Attitudes towards taxation and public spending, 1983-2021
These attitudes are reasonably consistent across the main political parties. Conservative Party supporters are more likely to favour keeping tax and spending as it is now, but there is very limited appetite for cutting both taxes and spending from any major party’s supporters. There is also a degree of consensus between different income levels, although modest and higher earners (those with a pre-tax household income of £30,000 or more) are those who – perhaps surprisingly – express most support for increased taxes and expenditure.
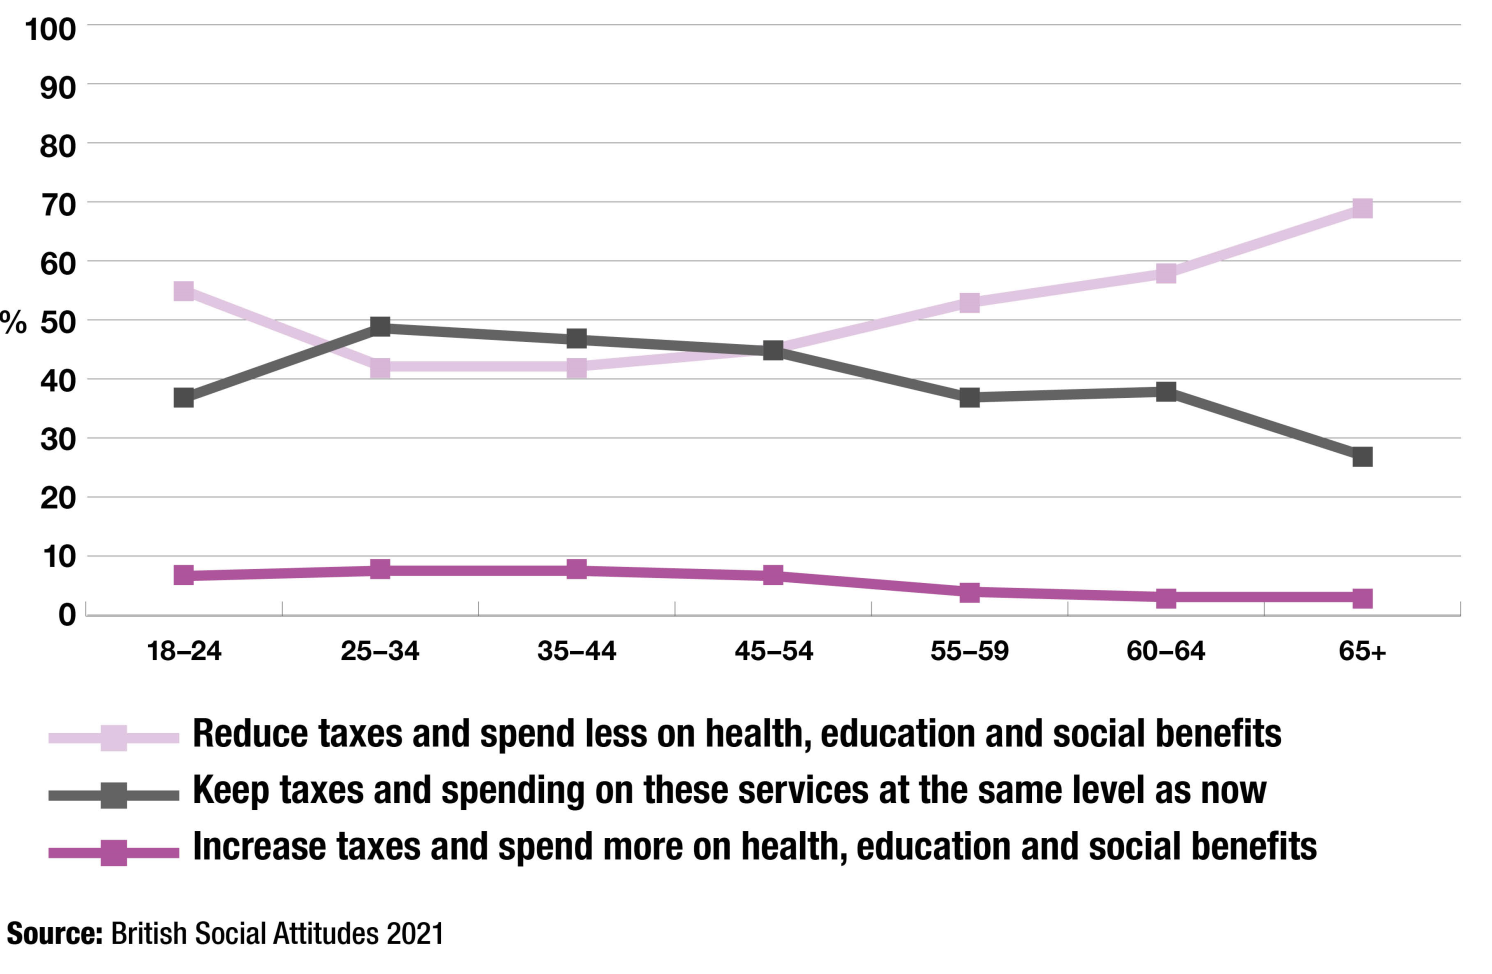
However, there are more striking differences between age groups (see Figure 2 below). Younger and older adults, who may be beneficiaries of higher spending on services such as education and health, are more likely to favour higher taxes and expenditure. In contrast, people aged between 25 and 54, who may be more exposed to higher taxes, narrowly favour maintaining current levels of taxes and expenditure.
Figure 2 - Attitudes towards taxation and public spending, by age group, 2021
The BSA survey does not specifically ask views about which public services could be cut, but has regularly asked about priorities for increased expenditure (see Figure 3 below, which shows only the most popular options). Education and health have consistently topped the list. The relative importance assigned to these services was perhaps reflected in government commitments to ‘ring-fence’ them from spending cutbacks in the years after 2010.
Figure 3 - Priorities for increased public spending, top 5, 1983-2021
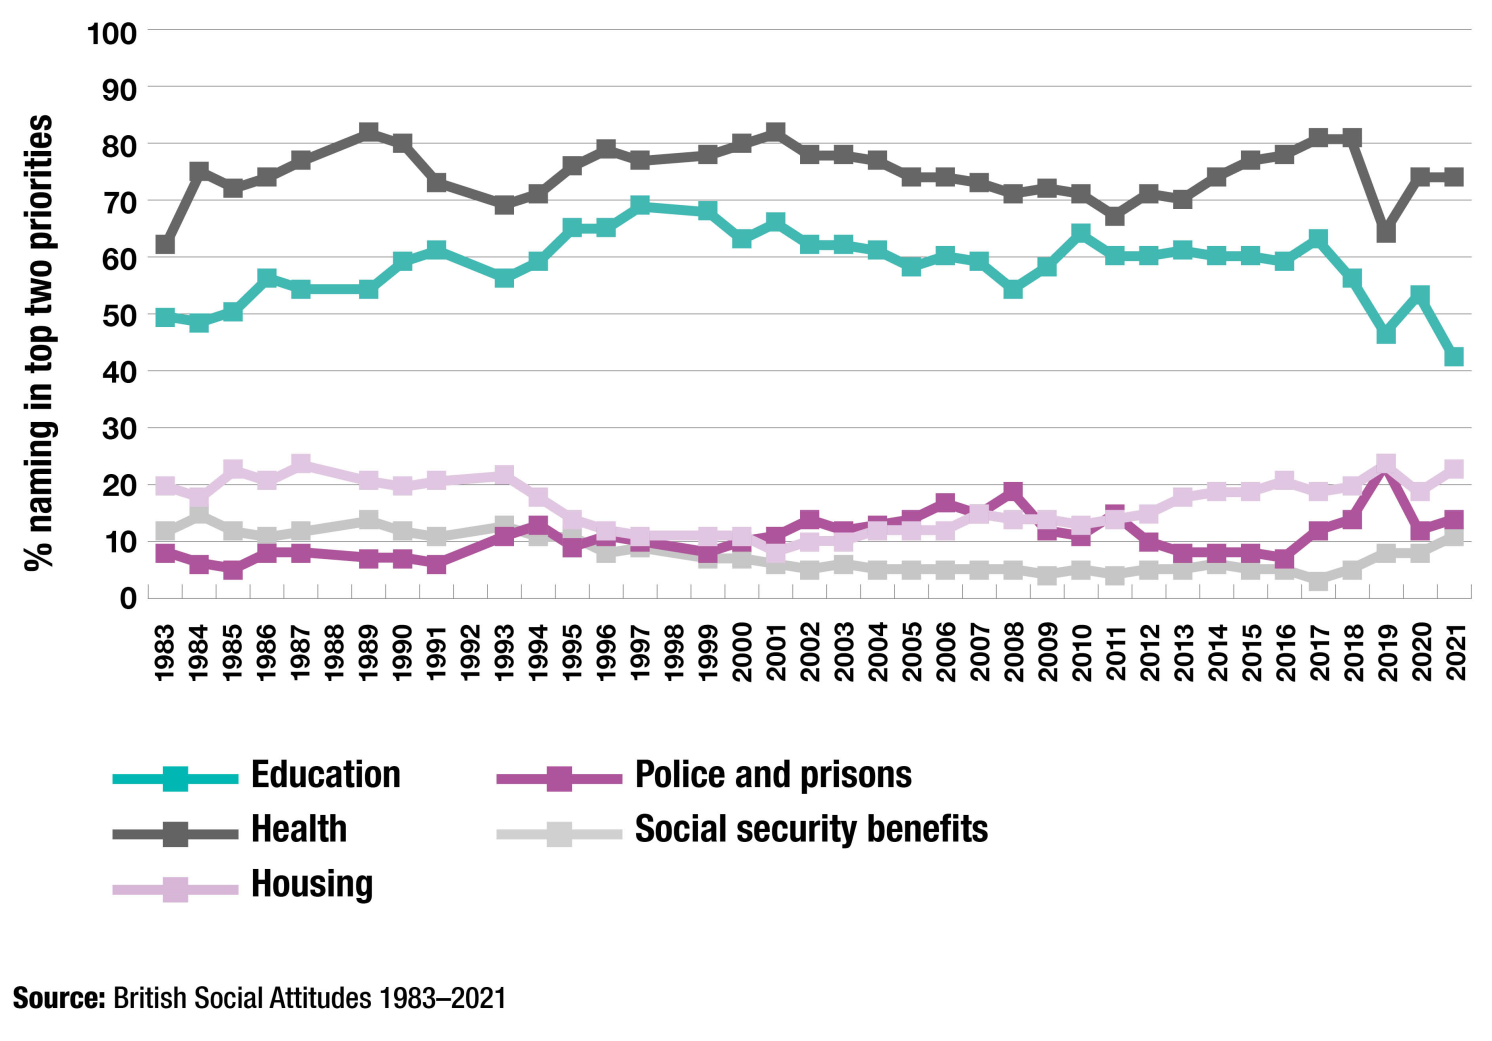
This perceived protection may also explain why other services became a higher priority for survey participants in recent years – though support for more spending on health bounced back during the pandemic. The priority attached to more spending on police and social security benefits has increased in the past five years, and support for more spending on housing has trebled since 2000.
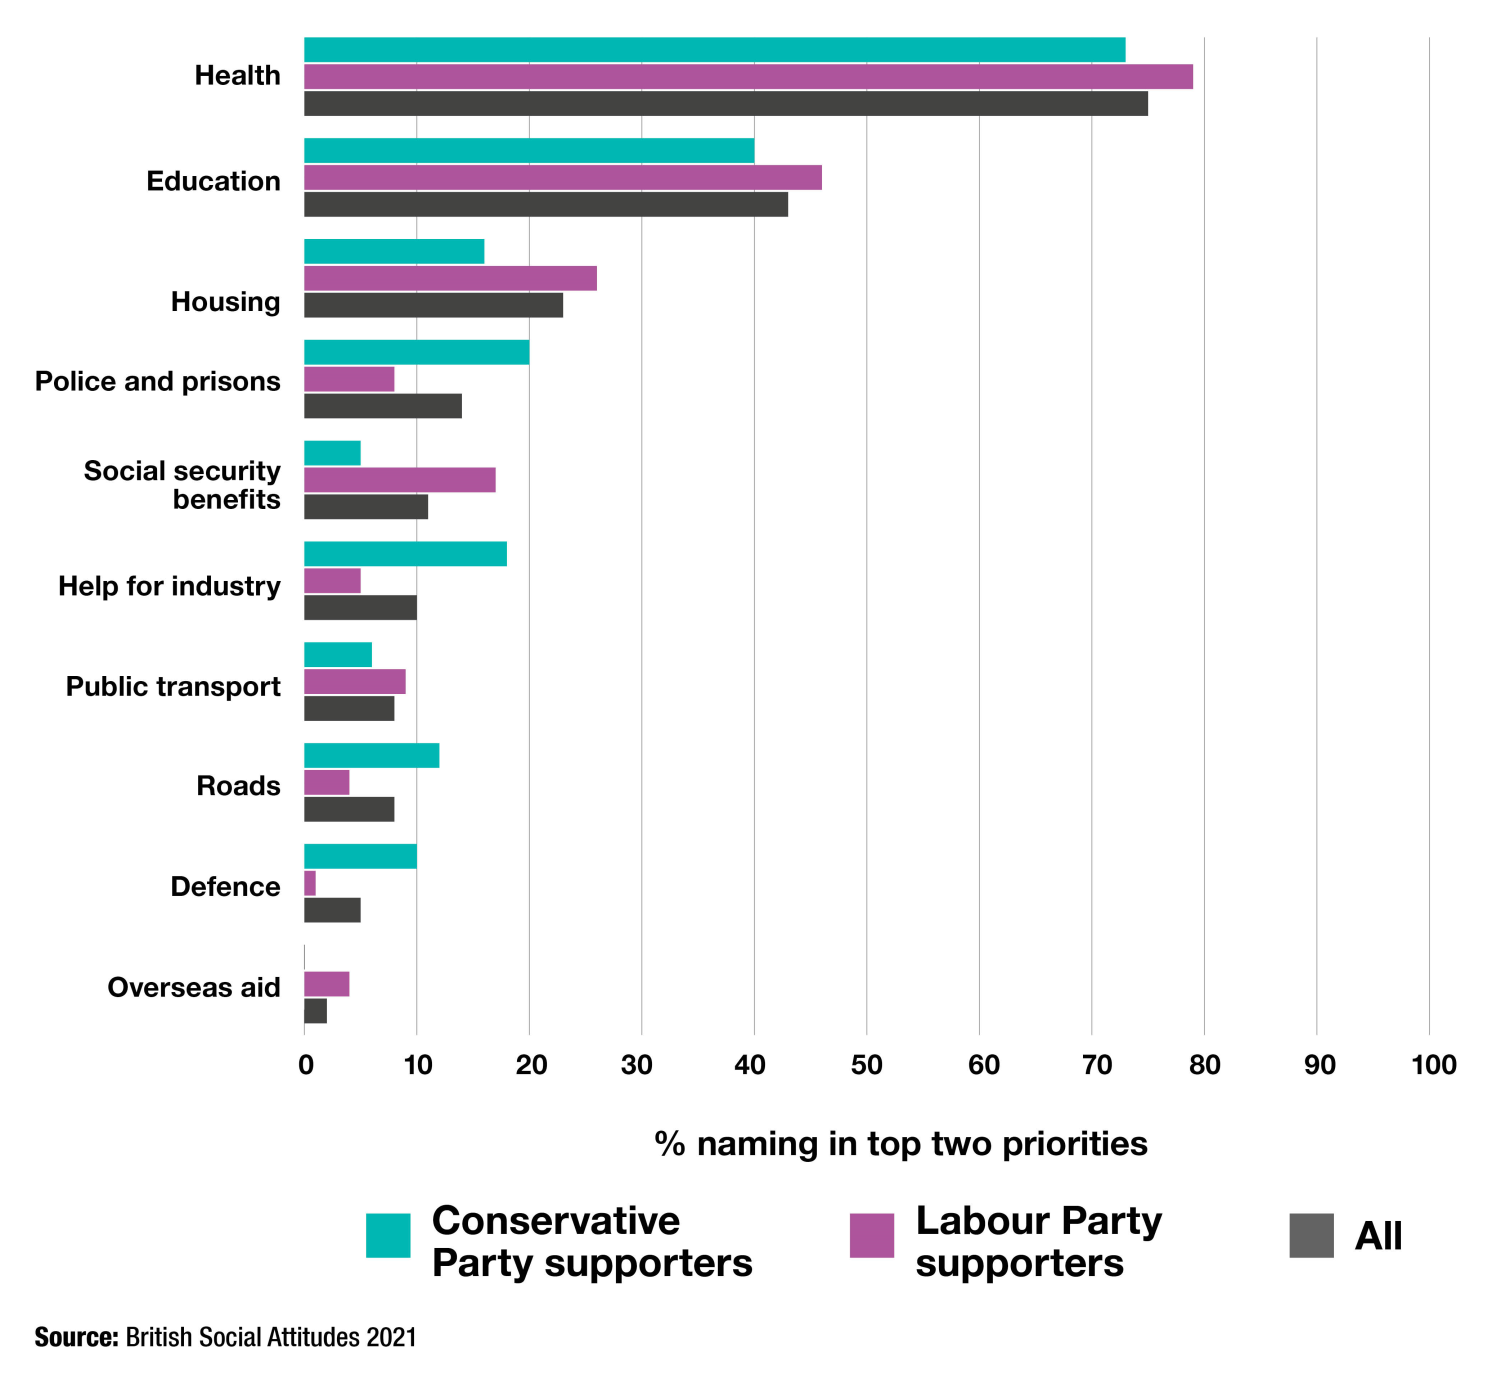
There are also party-political differences in priorities. Education and health are prioritised across the spectrum, but sharper differences can be seen in relation to other services (see Figure 4 below). Conservative Party supporters favour increased spending on police and prisons, support for industry, roads and defence, while Labour Party supporters focus on housing, social security, public transport and overseas aid.
Figure 4 - Top ten priorities for increased spending, 2021
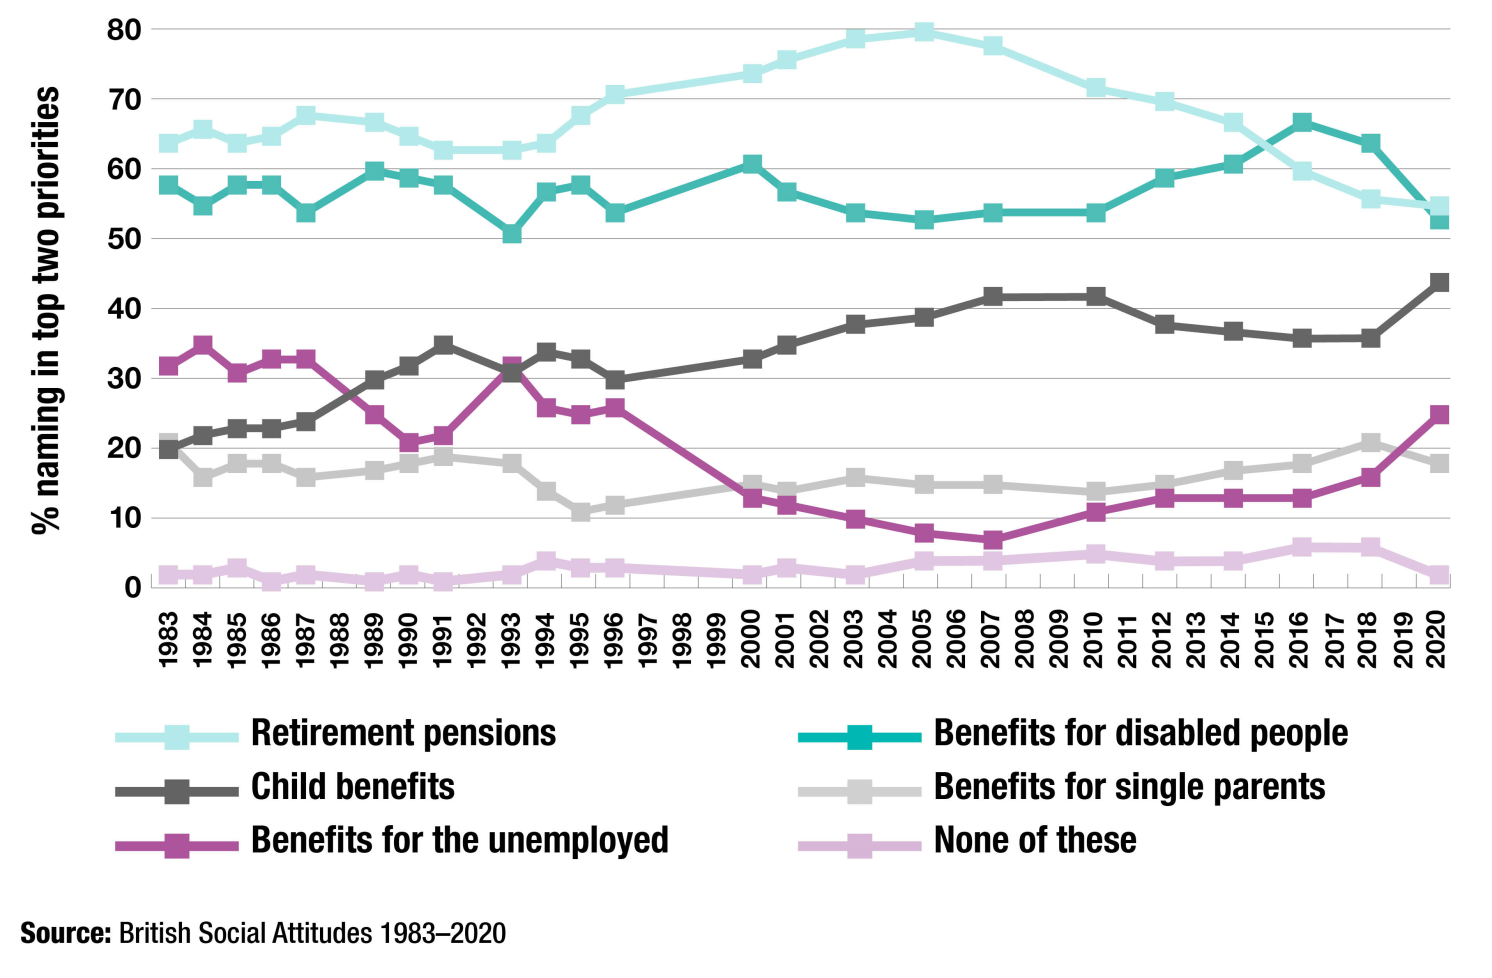
There has also been a noticeable shift in which social benefits people prioritise (though our survey only asks this question every two years, so our most recent data in the Figure 5 below is from 2020). In 2005, 80 per cent of the population prioritised an increase in state pensions; in 2020 this had fallen to 55 per cent; this may partly be explained by the “triple lock”, which has meant increases in line with or above inflation in pensions since 2010. More recently, between 2018 and 2020, there was a rise in relative support for increasing child benefits and unemployment benefits, while support for increased disability benefits, which had risen sharply in the previous ten years, also fell back.
Figure 5 - Priorities for increased spending on benefits, 1983-2020
The Chancellor has described the preparations for the Autumn Statement as “decisions of eye-watering difficulty”. Our survey was undertaken towards the end of last year, before Russia’s invasion of Ukraine precipitated the current cost-of-living crisis. At that stage, survey participants expressed no more appetite for public spending cuts than they have in nearly four decades of the BSA survey.
On the contrary, our figures suggest that public opinion has noted the relative protection of old age pensions, education and health budgets over the past decade, and wants this extended to other services and benefits in the future – though precisely which other services and benefits should be prioritised is a matter for considerable debate.


